To date, there has been no accurate way to measure how a brand’s investment in the consumer experience affects market share.
- A commonly used method for setting budgets exploits the relationship between share of media spend – or share of voice – and share of market.
- The current convention of relying only on mass-media share of voice for analysis, means marketers are missing out on valuable information on investment in owned and earned channels.
- This article looks beyond share of voice to a new metric – share of brand experience – and explains how it is an improvement on SOV for budget-setting in five ways.
Budget setting is a constant dilemma for marketers, in particular when trying to establish what is the appropriate level of investment that will realistically prompt business change and grow sales. In this article, we suggest that budget setting – and indeed media strategy – needs to incorporate a wide consideration set of touchpoints that include paid, owned and earned media assets. We discuss an empirically based methodology whereby all three can be combined and evaluated so that the path to sales growth can be determined.
A commonly used method for setting budgets is the Jones Model which exploits the relationship between share of media spend (share of voice or SOV) and share of market (SOM), based on a conjecture made by academic John Philip Jones. He proposed that in each category there was an ‘equilibrium share of media spend’ related to their share of market. A brand that invested more than its equilibrium would be expected to increase category share. Conversely, a brand that invested less than its equilibrium would decrease category share. Equilibrium increases with size of brand –so bigger brands need to invest more to stand still.
But is SOV analysis still relevant? In a world of increasingly incomparable and inconsistent metrics, share of voice is a stable and trackable metric for competitive context. In fact, in their Databank series, the IPA suggest the drive for efficiency in the past decade means we risk losing sight of the pivotal importance of relative SOV in driving effectiveness. They have found it’s the second most important driver of effectiveness after the creative work itself. They highlight that brands must still focus on overall levels of investment relative to competitors if they want to drive change.
But, of course, the important term here is overall investment; consumers are influenced by communication and messages that lie beyond paid media. The current convention of relying only on mass-media SOV for analysis means we are missing valuable information on investment in owned and earned channels.
When we think about how brands engage with customers, it is through ‘touchpoints’. These are simply points of contact with varying degrees of influence, where a brand and a consumer interact. They can be placed into three sets:
- Paid media (TV, internet display, outdoor, etc.). These are media that are bought and traded, and owned by a third-party media owner.
- Owned media (packaging, brand website, call centre, consumer-facing personnel, etc.). These are assets over which the brand owner has control.
- Earned media (word of mouth, social, expert/punter reviews, etc.). This is coverage accrued through other sources over which the brand has no control, earned without any investment.
The list of media (or touchpoints) within a category is long and can be different to that of other categories, but at this stage of the article we should acknowledge that it is only through these three sets of media that a consumer can engage with a brand. Therefore, it follows that consumer perceptions about brands, and long-run market share between brands, are determined by each brand’s use of touchpoints. To date, there has been no accurate or efficient way to measure a brand and its competitors’ overall investment in the consumer experience, or how it affects market share. Our solution to this shortfall is to look beyond SOV to a new metric, namely share of brand experience, which is an improvement on SOV in five key ways:
- A holistic measurement that recognises not all touchpoints are equal
Brands could have an identical SOV but very different communication mixes, each used to a very different effect. Brand experience share (BES) considers each individual channel (up to 35, including everything from TV to a recommendation from a friend), and weights the recall of each brand in each touchpoint by how influential the touchpoint is in people’s minds. In doing this, BES accounts for the impact of channels used, as well as how much they are being used.
- We measure the channels that matter in the real world, not just to marketers
Rather than using industry-reported spend as an indicator of what has been pushed out in advertising to people, each Touchpoints ROI Tracker study is based on speaking to consumers about what they’ve noticed, and what has actually influenced them when purchasing in a category. This means we consider the activity that resonates with potential customers, rather than just a blanket measure of everything that has been invested in.
The implied growth equation for the category is:
Change in Market Share = 0.3398 x (Brand Experience Share – Share of Market)
The growth coefficient (0.3398 in this case) describes by how much market share will change for one point of excess brand experience share.
The touchpoints research can now be used to help prioritise the paid, owned and earned channel mix.
- BES has far stronger correlation with market share than SOV
As BES data is more granular, comprehensive and consumer focused, it is unsurprising that it has a stronger correlation with market share. For example, for an FMCG category which had 67% correlation between SOV and SOM, our BES analysis found 95% correlation. This suggests that concentrating on growing brand experience – rather than an optimal SOV level – would be more likely to accomplish change, and more effective at doing so.
- A proven statistically significant causal relationship
But does correlation definitely mean causation? Using the Dynamic Jones Analysis approach, we have tested the BES correlation over time to prove that it doesn’t just have a better correlation with market share, but an actual effective causation.
Using our previous work, we knew the equilibrium BES (i.e. the BES required to stand still) for each brand, and the excess brand experience level where BES is subtracted from SOM. The theory is, that if a brand achieves more than equilibrium (positive excess), the brand is expected to increase market share, and if a brand achieves less than equilibrium (negative excess), it is expected to decline in market share. The ‘delta’ (change in value) for a brand’s market share in our example was analysed against the excess BES figures, and a statistically significant causal relationship was found. This then enables us to give an ‘elasticity‘ of response by sector: moving BES by x%, will give an increase of SOM by y%.
What we are doing here is to reinterpret Dynamic Jones Analysis by replacing share of paid media spend with share of brand experience. We believe that using a more holistic measure of a brand’s touchpoints is a better determinant of market share (than share of paid media). The results are more intuitive and more statistically robust.
In our example (Figure 1), every one point of excess BES was shown to grow market share by 0.34 percentage points. Compare this to the traditional approach where for every one point of excess SOV, market share will grow by 0.04 percentage points. BES is 8.5 times more effective than media SOV at driving growth.
Figure 1: Example analysis – FMCG category
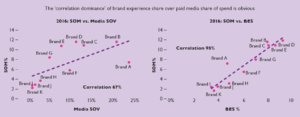
Source: Touchpoints research, Nielsen, TGI
- From simply setting budgets to indicating the right channel mix
The real benefit of this approach is its impact on the plan. Whereas traditional SOV analysis provides a guide to overall budget levels, it doesn’t tell you where best to invest. With the depth of data brand experience share analysis has on individual touchpoints, we can create a simulation tool which allows the user to change the model and unpick how adjustments in investment across paid, owned and earned channels actually impact market share. The corresponding change in sales volume can then be calculated. We can then assess how much it will cost to drive growth in the most effective way.
The balance for the marketer is to find a budget-setting approach that is stable and trackable, and yet one that is accurate and accountable. We now have a methodology that extends SOV thinking to a wider set of touchpoints. This enables us to work with clients to evaluate the entire communications ecosystem across paid, owned and earned media, to properly evaluate how consumers experience brands, and provide a direct link to how investment shapes this. Putting consumer brand experience at the heart of budget planning, rather than spend levels, provides an enhanced and more holistic way to build our understanding of how what we do affects the bottom line.
Touchpoints ROI Tracker utilises the MCA methodology. All rights to the MCA® measurement system including CCF™, BEP™ and BES™ are owned by Integration (Marketing and Communications) Limited and licensed to Publicis Media Limited and its affiliates.


Comments are closed.